Data Explorer package in R
While other blog posts will do a much better job of explaining the Data Explorer package in R, it still seemed useful to mention it here.
A huge hurdle to data analysis is data cleaning, and to effectively develop a strategy to efficiently prepare data for analysis, a basic snapshot of the data is helpful.
Enter the Data Explorer package, a set of tools that can provide minimal descriptive information for not much effort at all. With a single command, you can take a raw dataset, and produce a useful report that you can use to start working on your plan of data cleaning attack.
I downloaded a portion of the Social Indicators Survey from Columbia University, and picked a small subset of variables.
Using this small set of code, I produced the report below.
library(DataExplorer)
sis<-read.csv(“siswave3v4impute3.csv”)
sis_sm <- as.data.frame(with(sis, cbind(sex, race, educ_r, r_age, hispanic, pearn,
assets,poor,read,homework,black, police)))
create_report(sis_sm)
Data Profiling Report
Basic Statistics
The data is 34.8 Kb in size. There are 453 rows and 12 columns (features). Of all 12 columns, 9 are discrete, 3 are continuous, and 0 are all missing. There are 1,245 missing values out of 5,436 data points.
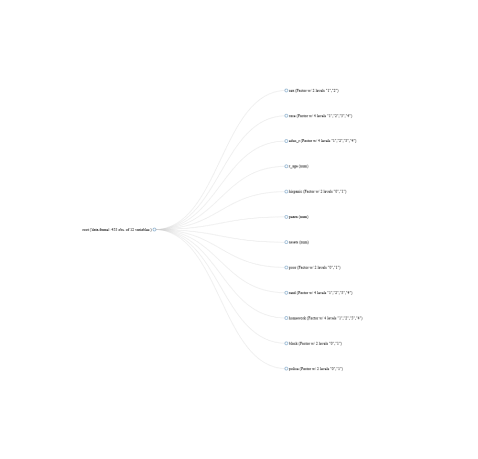
Data Structure (Text)
## 'data.frame':    453 obs. of  12 variables:
##  $ sex     : Factor w/ 2 levels "1","2": 2 1 2 1 2 2 1 2 2 1 ...
##  $ race    : Factor w/ 4 levels "1","2","3","4": 3 1 1 2 3 3 3 4 1 4 ...
##  $ educ_r  : Factor w/ 4 levels "1","2","3","4": 4 4 2 2 2 1 1 4 4 2 ...
##  $ r_age   : num  40 28 22 24 31 42 36 63 69 24 ...
##  $ hispanic: Factor w/ 2 levels "0","1": 2 1 1 1 2 2 2 1 1 1 ...
##  $ pearn   : num  14400 14400 12000 15000 8000 9600 2400 9600 NA NA ...
##  $ assets  : num  5000 50000 4000 NA NA 6000 NA 1250 100000 NA ...
##  $ poor    : Factor w/ 2 levels "0","1": 1 1 1 2 2 2 2 2 2 2 ...
##  $ read    : Factor w/ 4 levels "1","2","3","4": NA NA NA NA NA NA NA NA NA NA ...
##  $ homework: Factor w/ 4 levels "1","2","3","4": NA NA NA NA 4 1 1 NA NA NA ...
##  $ black   : Factor w/ 2 levels "0","1": 1 1 1 2 1 1 1 1 1 1 ...
##  $ police  : Factor w/ 2 levels "0","1": 2 2 1 1 2 2 1 NA 2 2 ...
Data Structure (Network Graph)
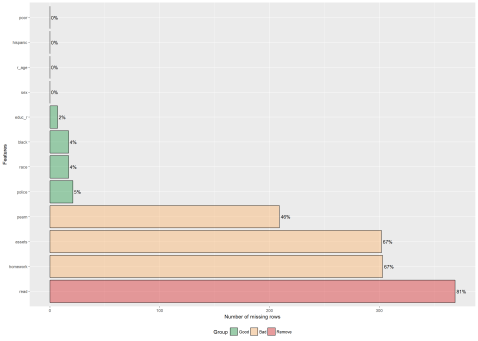
Missing Values
The following graph shows the distribution of missing values.
Data Distribution
Continuous Features (Histogram)

Discrete Features (Bar Chart)

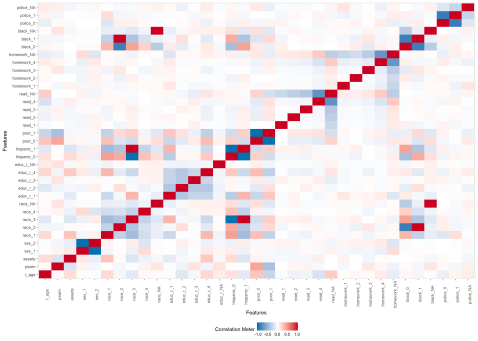
Correlation Analysis
Buy Books From Amazon!

Flickr Photos


Map

